Welcome to Technology Cue, your trusted partner for Data Visualisation Services in Australia. In today’s data-driven era, businesses require effective and visually engaging ways to comprehend complex data and derive actionable insights. At Technology Cue, we specialize in creating logical dashboards and interactive reports using innovative data Visualisation techniques. By understanding your company, key performance indicators (KPIs), and business drivers, we provide tailored solutions that empower you to make data-driven decisions. Let us help you unlock the power of data Visualisation to transform your business.
Data Visualisation & Power BI Specialists in Australia
Delivering data analytics solutions which make a real difference on your business
Book A Free Discovery CallData Visualisation and Power BI Services in Australia: Transforming Insights into Action
The Importance of Data Visualisation
Data Visualisation is the display of information using visual elements such as infographics, charts, and animations. It simplifies complex data relationships and presents data-driven insights in a clear and intuitive manner. At Technology Cue, we recognize the significance of data Visualisation in effectively conveying ideas and driving informed decision-making. Through visually appealing and interactive Visualisations, we streamline the decision-making process and enable the creation of complex models with ease. Data Visualisation is the process of presenting data in a graphical or visual format, making it easier to understand and interpret. Data Visualisation is a critical component of a business intelligence project as it helps stakeholders make informed decisions based on insights drawn from the data.
To work with data Visualisation and reporting in a business intelligence project, you should have a good understanding of:
- Data Visualisation best practices: You should know the best practices for creating effective data Visualisations, including choosing the right chart type, using color effectively, and avoiding clutter.
- Reporting tools: You should be familiar with reporting tools such as Microsoft Power BI or SQL Server Reporting Services (SSRS), which allow you to create interactive and visually appealing reports.
- Dashboard design: You should know how to design effective dashboards that provide a snapshot of key performance indicators (KPIs) and allow stakeholders to monitor business performance in real-time.
- User experience design: You should understand the principles of user experience (UX) design, which involve designing interfaces that are easy to use and understand, and that help users achieve their goals.
- Data storytelling: You should know how to create a compelling narrative around the data, using storytelling techniques to help stakeholders understand the insights and make informed decisions.
Some of the services that we our certified Data Visualisation Specialist can offer includes:
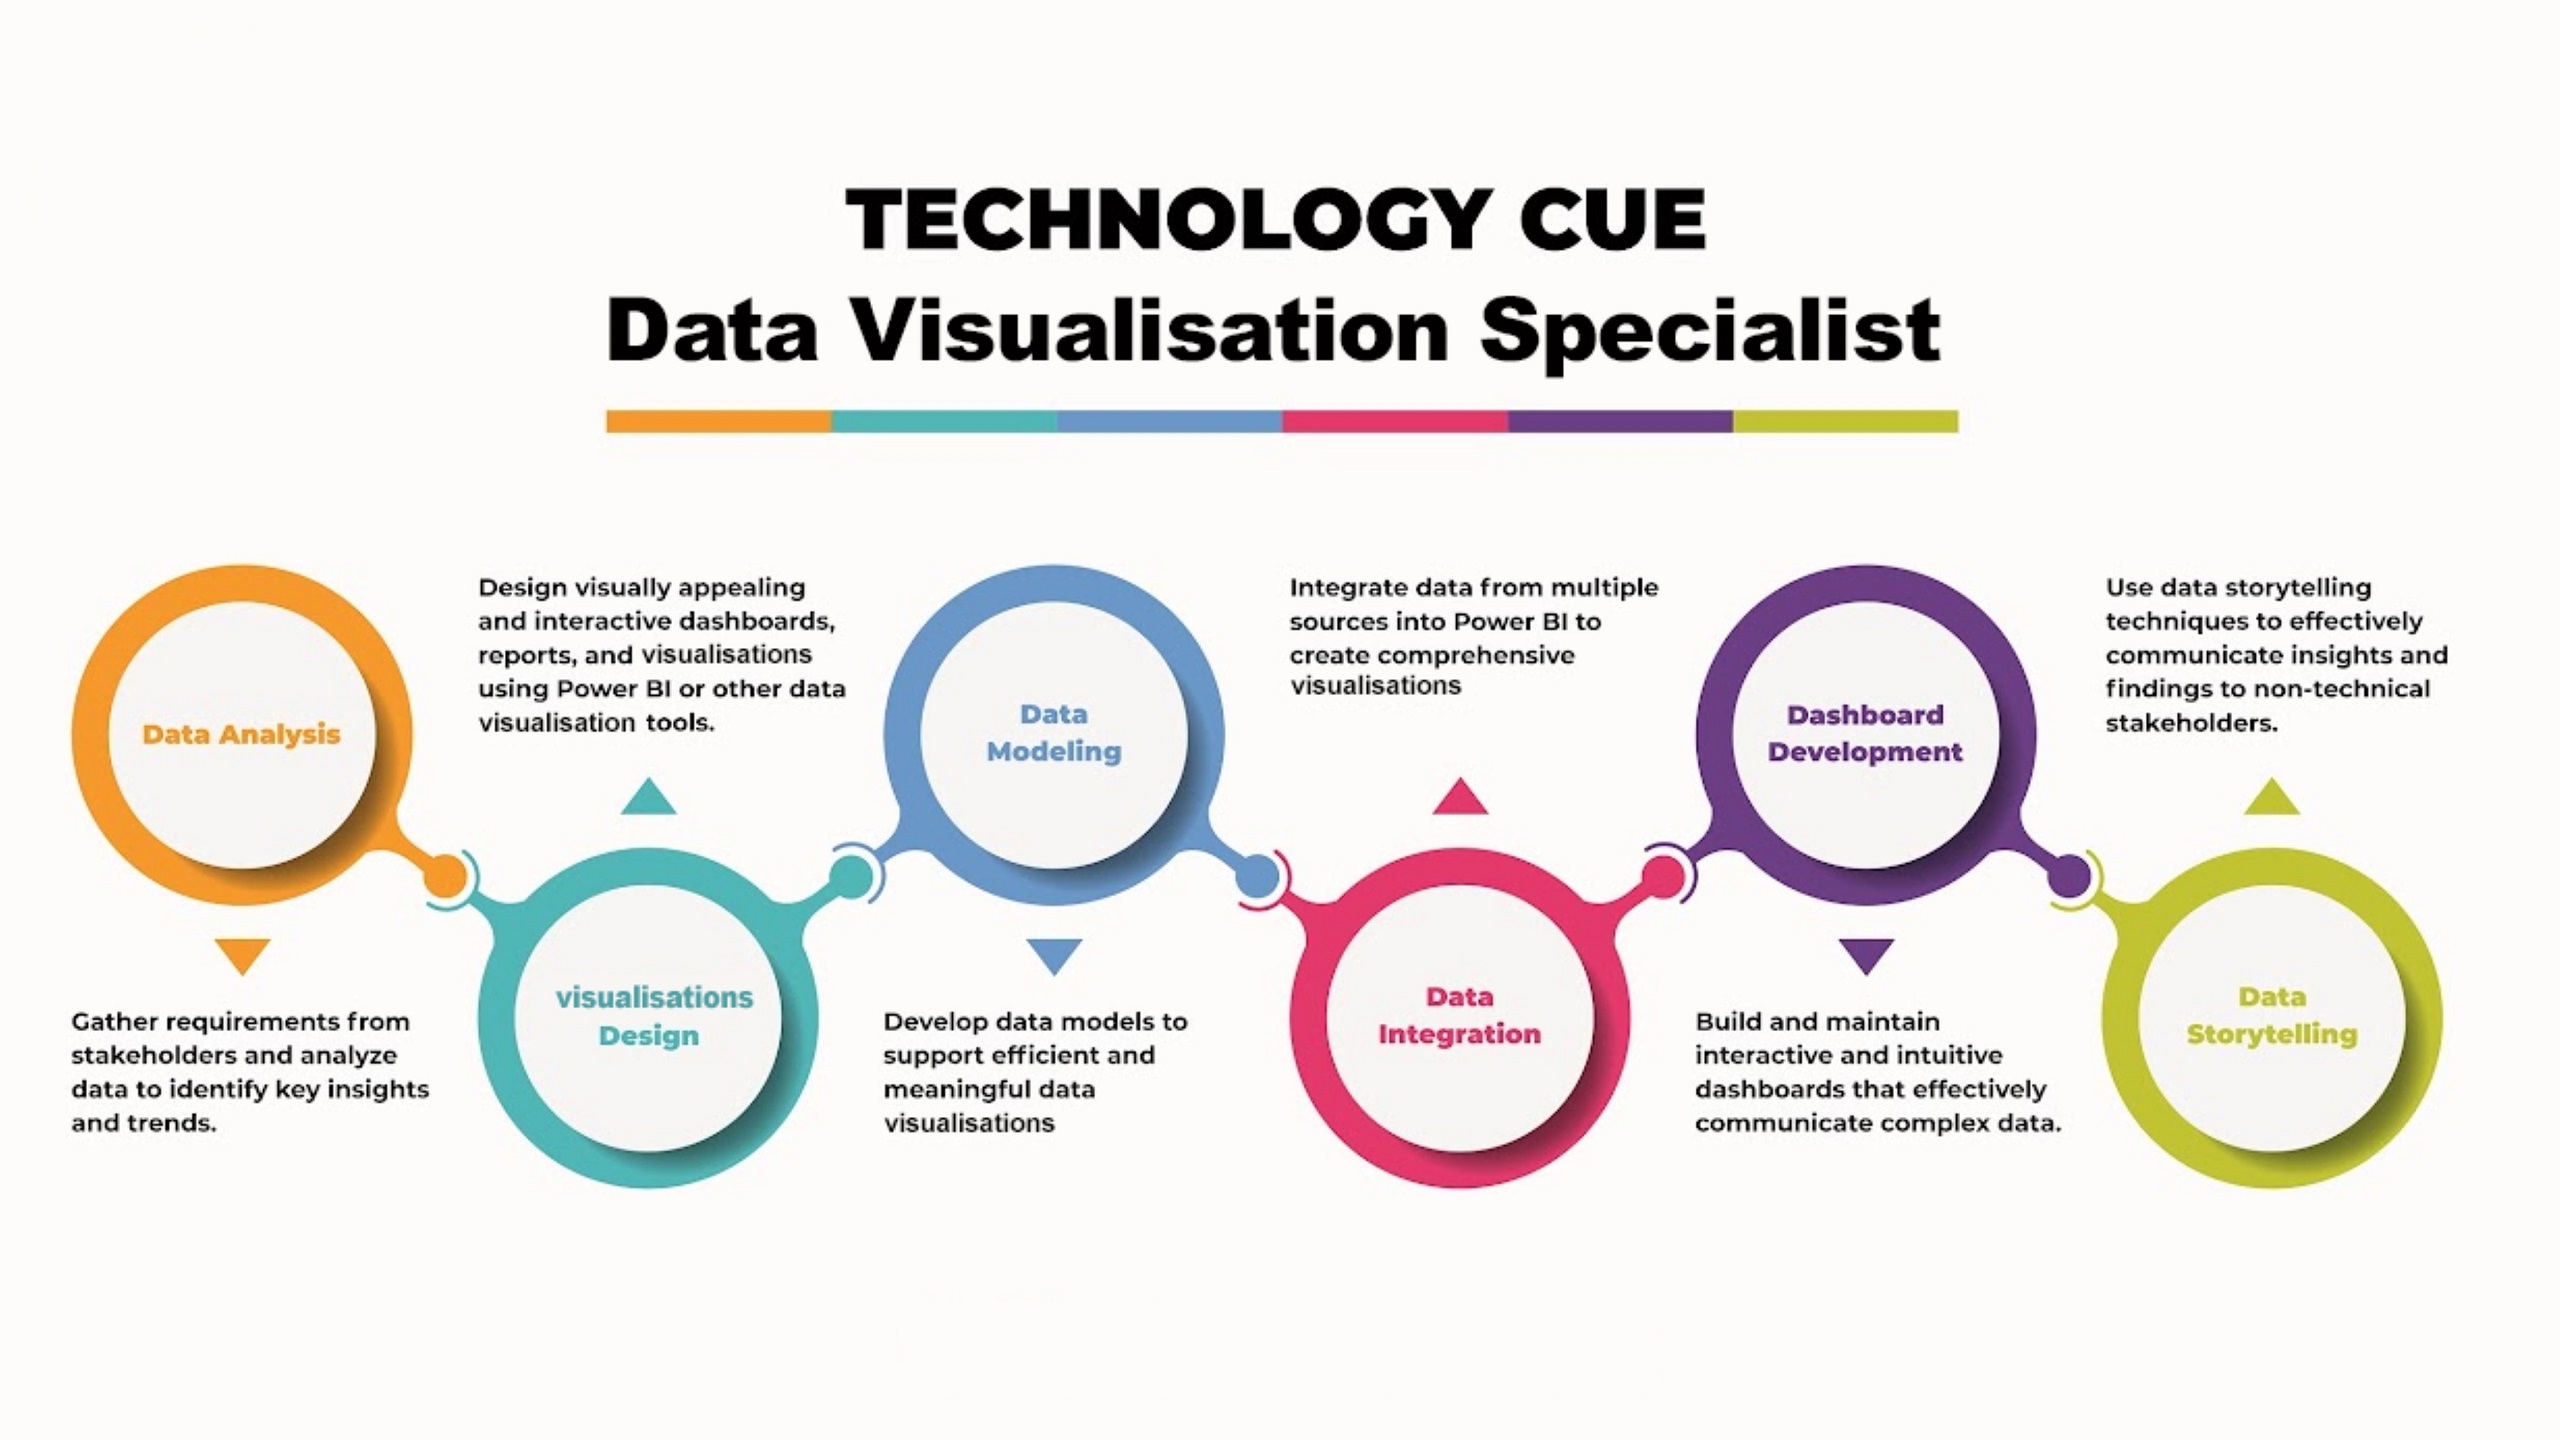
1. Data Analysis: Gather requirements from stakeholders and analyze data to identify key insights and trends.
2. Visualisation Design: Design visually appealing and interactive dashboards, reports, and Visualisations using Power BI or other data Visualisation tools.
3. Data Modelling: Develop data models to support efficient and meaningful data Visualisation.
4. Data Integration: Integrate data from multiple sources into Power BI to create comprehensive Visualisations.
5. Dashboard Development: Build and maintain interactive and intuitive dashboards that effectively communicate complex data.
6. Report Automation: Automate the generation and distribution of reports and dashboards to ensure timely and accurate information delivery.
7. Data Storytelling: Use data storytelling techniques to effectively communicate insights and findings to non-technical stakeholders.
8. User Training and Support: Provide training and support to users on Power BI tools and functionalities.
Why Businesses Need Proper Data Visualisation Services
Proper data Visualisation services offer numerous benefits to businesses. When executed effectively, data Visualisation provides a more elegant way to convey even the most difficult concepts than lengthy paragraphs. It streamlines the decision-making process and facilitates the creation of complex models, resulting in better projections for sales, growth, and customer satisfaction. By visualizing data, businesses can identify trends, outliers, patterns, and clusters, enabling them to pinpoint problem areas and make informed decisions for improvement.
Benefits of Data Visualisation to Firms and Companies
Trends and Data Visualisation: Data Visualisation enables businesses to recognize various trends across time. By analyzing historical and current data, businesses can make accurate forecasts about their products, sales, or any other KPI. Identifying existing trends and projecting future ones allows businesses to gain insights into their current position in the industry and make informed decisions for future success.
Market Response: Reliable tracking and clear presentation of key performance indicators on real-time dashboards enable analysts and decision-makers to respond quickly to significant changes. Early trend detection empowers companies to take appropriate action, maximizing gains or minimizing losses based on market conditions.
Clear Understanding: Data Visualisation allows businesses to handle vast amounts of information effectively, providing accurate and in-depth insights into crucial areas of their organizations. It bridges departmental gaps by enabling leaders to understand all KPIs, facilitating swift and intelligent decision-making.
Emphasizes the Intended Message: Visual information is easier to comprehend and remember than text-based resources. By incorporating engaging images and Visualisations, businesses can effectively communicate their message and reinforce the understanding of data-driven insights.
Data Visualisation Services in Australia
At Technology Cue, we offer comprehensive Data Visualisation Services in Australia, tailored to meet the unique needs of businesses across various industries. Our expert team of data Visualisation professionals combines their expertise in design and development to create visually stunning and interactive dashboards using Power BI. We collaborate closely with our clients to understand their data requirements and business objectives, ensuring that the Visualisations effectively communicate insights and drive informed decision-making.
Unlocking Insights with Power BI
Power BI, a leading business intelligence tool by Microsoft, offers a wide range of features and capabilities to transform raw data into interactive Visualisations and reports. Our team of skilled professionals harnesses the power of Power BI to create dynamic and customized dashboards that showcase key metrics, trends, and patterns. By utilizing advanced Visualisations, such as charts, graphs, and maps, we enable businesses to gain a comprehensive understanding of their data and uncover valuable insights.
Designing Intuitive User Experiences
A crucial aspect of effective data Visualisation is ensuring an intuitive user experience. At Technology Cue, we prioritize user-centric design principles to create Visualisations that are easy to navigate and understand. By focusing on information hierarchy, interactive features, and visual storytelling, we enable users to explore and interact with data effortlessly. Our goal is to empower Australian institutions to derive insights from complex data sets, regardless of their technical expertise.
Enriching Insights through Data Visualization
Effective data Visualisation goes beyond aesthetics; it has the power to communicate complex information and drive meaningful action. At Technology Cue, we work closely with Australian institutions to understand their data challenges and goals. Whether it’s analyzing customer behavior, optimizing operations, or identifying market trends, our data Visualisations provide the clarity and insights needed to make strategic decisions.
Empowering Australian Institutions
As an Australian-based data Visualisation company, we are committed to supporting local businesses and organizations. We recognize the importance of acknowledging the traditional owners of the land, including Aboriginal and Torres Strait Islander peoples. We strive to incorporate culturally sensitive design elements and narratives into our Visualisations, respecting the rich cultural heritage and diverse perspectives that make Australia unique.
At Technology Cue, our Data Visualisation and Power BI Services in Australia empower organizations to unlock the true potential of their data. By leveraging the capabilities of Power BI and employing user-centric design principles, we transform raw data into captivating Visualisations that drive actionable insights. As an Australian-based company, we are committed to supporting local institutions and incorporating culturally sensitive design elements. Let us help you turn your data into a powerful tool for informed decision-making. Contact us today to embark on your data Visualisation journey in Australia.
Explore our Power BI Adoption Framework!
We have developed a unique and practical Adoption Framework based on our deep expertise and experience building Power BI solutions for mid to large size organizations.

Office Location
Level 7, 127 Creek Street, Brisbane CBD, QLD, 4000
Phone
1300 984 835
Email Address
info@technologycue.com.au